
In this ECG Cases blog we use use sequence photography to correlate ECGs with the dynamic process of occlusion and reperfusion…
Written by Jesse McLaren; Peer Reviewed and edited by Anton Helman. June 2025
Six patients presented with potentially ischemic symptoms. Using the concept of sequence photography, can you correlate symptoms and ECG to identify where they are in the dynamic process of occlusion/reperfusion?
Case 1: 60 year old with epigastric pain and vomiting
–
Case 2: 60 year old, recent inferior STEMI which presented with chest pain and treated with RCA stent, now returning with cough and shortness of breath
–
Case 3: 60 year old with unstable angina. First ECG at triage with chest pain, and second ECG when pain resolved after aspirin and nitro.
–
Case 4: 55 year old one week of exertional chest pain, now painfree. Old then new ECG:
–
Case 5: 90 year old with flash pulmonary edema. Baseline then new ECG.
–
Case 6: 60 year old with 5 days of chest pain, ongoing
–
The art of sequence photography in ECG interpretation
Let’s put the art in heart! This is the fourth blog post looking at the Art of Occlusion MI: how we can use visual concepts to identify acute coronary occlusion on ECG, and how art helps explains the science of OMI. Previous posts looked at mirror image, then scale vs proportionality, and then overall impression of individual ECGs – and this post will look at sequence photography. Each ECG is just a snapshot in time, but acute coronary occlusion is a dynamic process that can fluctuate between occlusion and reperfusion and back to occlusion again. Sequence photography helps us understand this dynamic process.
For the STEMI paradigm there is only one still shot that matters: the ECG that meets STEMI criteria, which is like the third photo of the hiker in mid-air. While serial ECGs are recommended, these are dichotomized into “STEMI positive” or “STEMI negative”. This would be like dichotomizing all these photos into “mid-air” vs “not mid-air”. But the photos before and after the jump are just as important, and might be the only evidence of the jump if the photo mid-air was not captured. Instead of a single shot, the OMI paradigm uses sequence photography to capture the dynamic process of occlusion and reperfusion.
- Early occlusion: just as the photo before the jump shows the initial process and predicts the mid-air photo, early signs of occlusion (like hyperacute T waves, or subtle STE with reciprocal STD) can identify OMI early – and might remain the only sign of occlusion.
- Spontaneous reperfusion: just as the photos after the jump show the landing and confirm that a recent jump has occurred, resolved ischemic symptoms with reperfusion T wave inversion can identify a recent occlusion that has reperfused – either from a stent, or spontaneous reperfusion at risk for reocclusion. Wellens syndrome describes spontaneous LAD reperfusion before after brief occlusion: patients present after an episode of chest pain that resolved, with intact R waves and reperfusion T wave inversion that progress from biphasic to inverted. The same process and ECG changes of occlusion/reperfusion can happen with any artery, including posterior reperfusion T wave inversion whose mirror image is tall anterior T waves. But the bigger the jump the harder the landing, and patients may present with resolved symptoms and reperfusion T wave inversion along with Q waves – indicating that some infarct has already occurred (ie not Wellens).
- From reperfusion to reocclusion: if a vessel has spontaneously reperfused, it can spontaneously reocclude. This can produce a reversal of the photo sequence: from T wave inversion to pseudonormalization (T wave normalization during reocclusion), and then hyperacute T waves and ST elevation.
- Refractory occlusion: if patients present with subacute and persisting symptoms, Q waves and T wave inversion can indicate refractory occlusion.
Some photos are difficult to interpret in isolation, and need careful reconstruction with the events. Patients may present at any point in this sequence of occlusion/reperfusion, and we need to correlate patient symptoms and ECGs to identify where in the sequence they are – so that we can intervene to prevent them from falling off a cliff.
Back to the cases
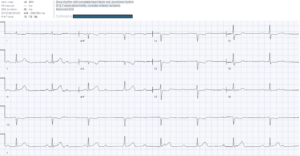
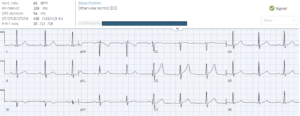
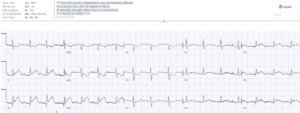
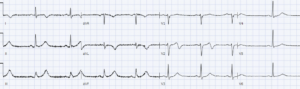
Case 1: 60 year old with epigastric pain and vomiting: early STEMI(-)OMI missed, progressed to STEMI(+)OMI
- Heart rate/rhythm: sinus rhythm
- Electrical conduction: 3rd degree AV block with junctional escape
- Axis: normal
- R-wave progression: normal
- Tall/small voltages: normal
- ST/T waves: subtle inferior hyperacute T waves with reciprocal TWI, concordant to its QRS but disproportionately deep, and STD V2-4
= AV block from RCA occlusion, STEMI(-)OMI
OMI not identified. ECG repeated an hour later after first trop came back at 250 ng/L:
Now resolved AV block but obvious infero-postero-lateral STEMI(+)OMI. Cath lab activated: 99% RCA occlusion, peak troponin 25,000 ng/L. Discharge ECG after reperfusion had inferior terminal T wave inversion:
–
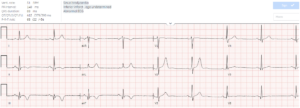
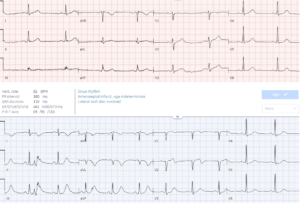
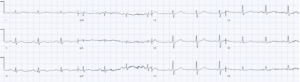
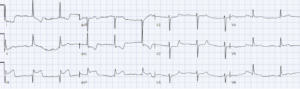
Case 2: 60 year old, recent inferior STEMI which presented with chest pain and treated with RCA stent, now returning with cough and shortness of breath. Recent reperfusion without signs of reocclusion
- H: sinus bradycardia
- E: normal
- A: normal
- R: early R wave in V2, mirror to posterior Q
- T: normal
- S: inferior Q wave with reperfusion T wave inversion, and tall T in V2 reciprocal to posterior reperfusion T wave inversion
= infero-posterior reperfusion with recent stent, no sign of reocclusion. Troponin was 200 ng/L, a decline from the recent admission. Patient diagnosed with respiratory infection.
–
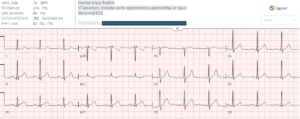
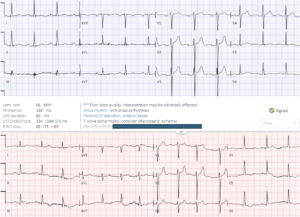
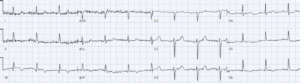
Case 3: 60 year old with unstable angina. First ECG at triage with chest pain, and second ECG when pain resolved after aspirin and nitro. From subtle occlusion to reperfusion, both missed
- H: normal sinus
- E: normal conduction
- A: normal axis
- R: early R wave in V2
- T: normal voltages
- S: first ECG had primary ischemic STD in aVL, discordant to its QRS, and reciprocal to subtle inferior ST elevation. Repeat had normalization of AVL along with inferior T waves deflating and inverting in III, along with taller T waves in V2 (posterior reperfusion)
= infero-posterior occlusion with spontaneous reperfusion. Initial troponin borderline positive at 30ng/L (normal <16 in females and <26 in males). Admitted as unstable angina. Luckily did not spontaneously reocclude before angiogram, which found 99% RCA occlusion with good flow. The peak troponin was only 650 ng/L.
–
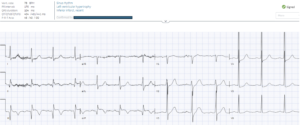
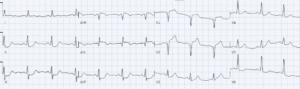
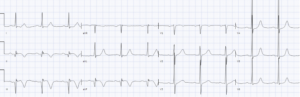
Case 4: 55 year old one week of exertional chest pain, now painfree. Old then new ECG. LAD occlusion with spontaneous reperfusion, then reocclusion
- H: normal sinus
- E: normal conduction
- A: normal axis
- R: new Q wave V1-2
- T: normal voltage
- S: T wave inversion I/aVL (with reciprocally tall inferior T waves) and biphasic T wave in V2
= resolved ischemic symptoms with anterolateral reperfusion T wave inversion, concerning for proximal LAD occlusion with spontaneous reperfusion after some degree of infarction (with Q waves this is not ‘Wellens’).
Chest pain recurred, with VF arrest that was defibrillated:
Pseudonormalization of T wave in I, ST elevation in aVL with reciprocal inferior STD, and hyperacute T wave in V1-2 – indicating spontaneous reocclusion of proximal LAD. Dual anti-platelet/heparin/nitro and cath lab activated, repeat ECG before angiogram:
Hyperacute T waves V1-2 have deflated, and lateral T waves have further inverted, indicating spontaneous reperfusion. At the time of angiography there was an 85% proximal LAD occlusion, and because of rapid reperfusion the peak trop was only 500 ng/L. Post-cath ECG showed further reperfusion T wave inversion:
–
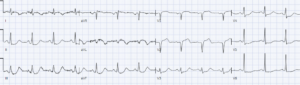
Case 5: 90 year old with flash pulmonary edema. Baseline then new ECG. From subtle reperfusion to obvious reocclusion
- H: normal sinus
- E: normal
- A: normal
- R: normal
- T: normal
- S: new ECG has subtle convex STE/TWI in III and TWI V5-6, and flattening of ST segment anterior
= flash pulmonary edema with potential infero-postero-lateral reperfusion. Repeat ECG:
Now obvious infero-postero-lateral STEMI, and 1st degree AV block. Cath lab activated: 99% RCA occlusion, first trop 2,000 and peak 10,000 ng/L. Discharge ECG shows reperfusion T wave inversion again:
–
Case 6: 60 year old with 5 days of chest pain, ongoing. Subacute occlusion MI
- H: normal sinus
- E: normal
- A: borderline left from inferior Q
- R: normal
- T: normal
- S: inferior Q, with convex STE and TWI
= subacute inferior OMI
Cath lab activated: 100% RCA occlusion, first trop 20,000 and peak 30,000ng/L. Discharge ECG had resolution of ST segment, ongoing Q and reperfusion TWI
–
Take home points on Art of Occlusion MI: Sequence Photos
- Hyperacute T waves and subtle ST elevation with reciprocal ST depression can provide an early snapshot of occlusion MI – and might remain the only sign of occlusion
- Resolution of ischemic symptoms along with regional T wave inversion (or reciprocally tall anterior T waves) can indicate spontaneous reperfusion, while subacute and persisting symptoms with Q waves and T wave inversion indicate refractory occlusion
- Spontaneous reperfusion is at risk for reocclusion, with recurrence of ischemic symptoms accompanied by ST/T pseudonormalization and then hyperacute T waves and ST elevation
For more cases see ECG Cases 23: Wellens syndrome, reperfusion and reocclusion MI
For small group, live and highly interactive ECG courses, including one on Occlusion MI, visit www.heartsECGcourse.com.

Leave A Comment